TikTok Metrics
This article explains the available TikTok metrics and how to interpret them in the platform.
TikTok
The data shown in the platform comes from the official TikTok API and corresponds to the profile’s organic activity.
For TikTok Business accounts, TikTok reports two types of videos:
➡️ Organic videos: posts visible on the public profile of the account.
➡️ Videos set as “Only show in ads”: posts used only in ad campaigns that do not appear on the public profile but are publicly accessible as ads.
Considerations
Differences between personal and business TikTok accounts: The metrics available for personal accounts are more limited than for business accounts.
Posts filtered due to violations: If a post does not appear in analytics, TikTok may have filtered it for issues such as music copyright infringement. In that case, the TikTok API ignores the video, and it cannot be retrieved in the platform, as detailed in their official documentation.
Missing data due to video inactivity: If metrics such as reach or total watch time do not show data, the video may have been inactive for more than 7 days, with no views, comments, likes, or shares. Interact with the video and wait 24–48 hours for the data to update.
Below, you’ll find all the available metrics for your TikTok account:
COMMUNITY · DEMOGRAPHICS · ACCOUNT · POSTS
COMMUNITY
✅ GROWTH
Followers: total number of followers at the end of the selected time range.
Posts: total number of posts published in the selected time range.
✅ BALANCE OF FOLLOWERS
The follower balance shows how your community changes day by day within the selected date range. It records all daily audience movements. If someone unfollows your account and follows again on different days, each action is counted separately.
Since TikTok added new metrics to its API, the follower balance works differently depending on the type of account connected:
Personal TikTok accounts: TikTok does not provide daily metrics for gained or lost followers for personal accounts. Because of this, the balance is calculated as the difference in followers compared to the previous day, without a daily breakdown.
TikTok Business accounts: TikTok provides daily metrics for gained and lost followers. Because of this, the platform can show a detailed balance, with gained and lost followers per day.
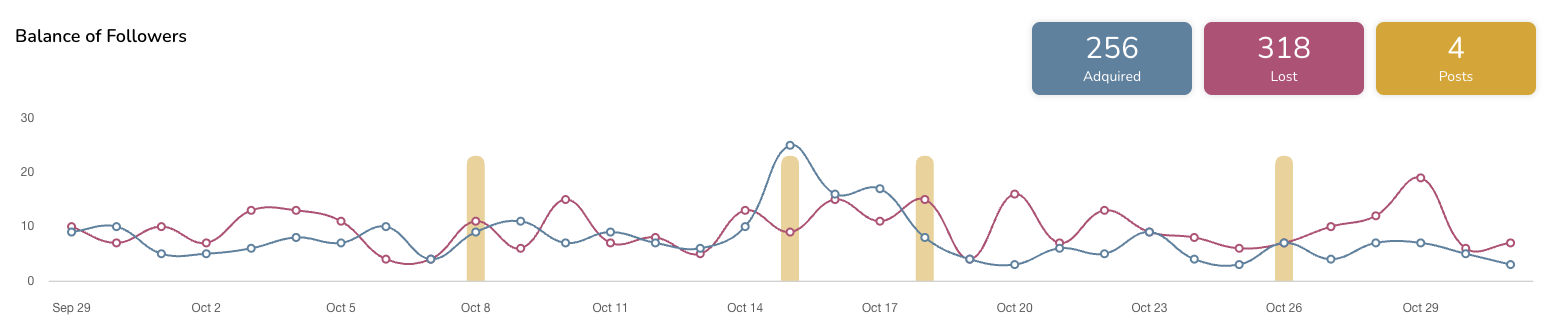
If your account is a Business account, the chart shows:
Followers gained per day (blue line)
Followers lost per day (red line)
Posts published on those days (yellow bars)
The totals for the period: Gained, Lost, and Posts
Data availability
The daily_new_followers and daily_lost_followers metrics from the TikTok API are available in the platform starting September 29, 2025.
For this reason:
If the range starts before September 29, 2025, you’ll still see the previous balance based on the difference from the previous day.
If the range starts on or after September 29, 2025, you’ll see the detailed balance, with gained and lost followers per day.
📝 Note on large removals
TikTok may remove fake or inactive accounts. These adjustments may not always appear in the daily lost followers metric, so the total follower count may change more than the sum of the daily values.
DEMOGRAPHICS
The demographics section is only available for TikTok Business accounts. TikTok generates these insights only when the account has at least 100 followers. If this minimum is not reached, the section does not appear in the platform.
Available data:
Distribution by gender.
Followers by country.
You can view this information as a chart or a table.
ACCOUNT
The account section is only available for TikTok Business accounts.
✅ PROFILE
Profile views: number of times your TikTok profile was visited during the selected period.
Posts: total number of posts published during the selected period.
✅ POSTS VIEWED IN PERIOD
This section includes posts that generated views during the selected period, regardless of when they were originally published.
Post views: total number of times your posts were viewed during the selected period.
Likes: total number of likes received on posts during the selected period.
Comments: total number of comments received on posts during the selected period.
Shares: total number of times posts were shared during the selected period.
POSTS PUBLISHED IN PERIOD
Shows the posts published within the selected time range. The data corresponds to the cumulative performance of each post, from its publication date up to yesterday. The time range filter only determines which posts are shown in the view, not the range of analyzed data.
ℹ️ Note: For personal accounts, this section displays limited information due to TikTok API restrictions.
✅ SUMMARY
Engagement: see the section What is engagement?.
Interactions: total interactions on posts.
Average reach/post: average reach per post.
Post views: total number of post views.
Posts: total number of posts published during the selected period.
✅ INTERACTIONS
Likes: total likes on posts.
Comments: total comments on posts.
Shares: total shares on posts.
Posts: total number of posts published during the selected period.
✅ IMPRESSIONS SOURCES
Percentage of where your post impressions come from.
For You: impressions generated from the For You page, where posts are shown based on user preferences and viewing behavior.
Following: impressions generated from the feed of users who follow you.
Profile: impressions generated when users visit your profile.
Search: impressions generated from the Discover page when the video appears in search results.
✅ AVERAGE VIDEO VIEWS
This data helps you understand the average watch time of your videos and the retention rate of your TikToks.
Average watch time/video: average time users spend watching your videos.
Average video length: average duration of your videos.
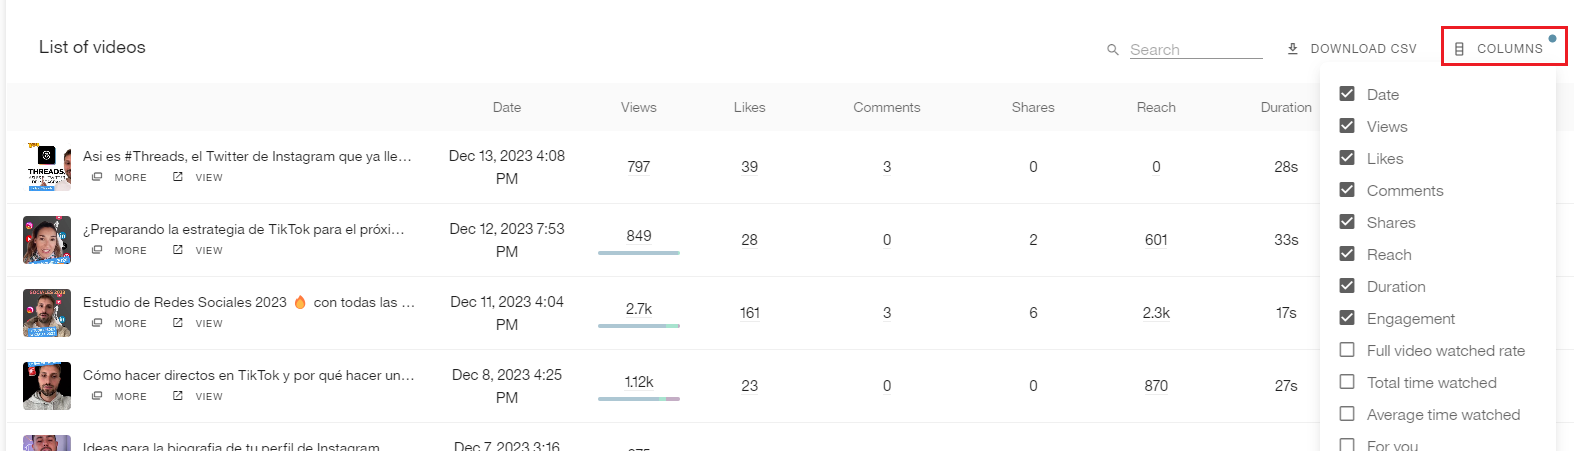
✅ LIST OF POSTS
Remember that image posts are only available for personal accounts. Check the article Schedule and publish on TikTok.
Type: post type (image or video).
Date: date the post was published.
Views: total number of post views. Includes a breakdown of the percentage by source.
Likes: total number of likes on the post.
Comments: total number of comments on the post.
Shares: total number of times the post was shared.
Reach: total reach of the post.
Duration: duration of the post in seconds.
Engagement: see the section What is engagement?.
Full video views: percentage of views where the video was watched to the end.
Total watch time: total accumulated watch time of the post.
Average watch time: average watch time per view.
For You: percentage of views generated from the For You page.
Following: percentage of views generated from followers’ feeds.
Hashtag: percentage of views generated from a hashtag where the post appeared.
Sound: percentage of views generated from a sound used in the post.
Profile: percentage of views generated from profile visits.
Search: percentage of views generated from the Discover page when the post appeared in search results.
💡 You can customize the metrics table by clicking on the columns. In Business accounts, more metric options are available.
ℹ️ What is engagement?
Engagement measures how users interact with your content based on its reach or visibility.
In the platform, you can configure it using two different formulas.
Note: Engagement for competitors is calculated differently from your own account.
We recommend adding your own account as a competitor to make the data comparable.
See all the details here.
Want to build a TikTok marketing strategy? Don’t miss this tutorial and this TikTok study.